Swipe to make your pizza masterpiece.
Pizzas
Garlic Bread
Drinks
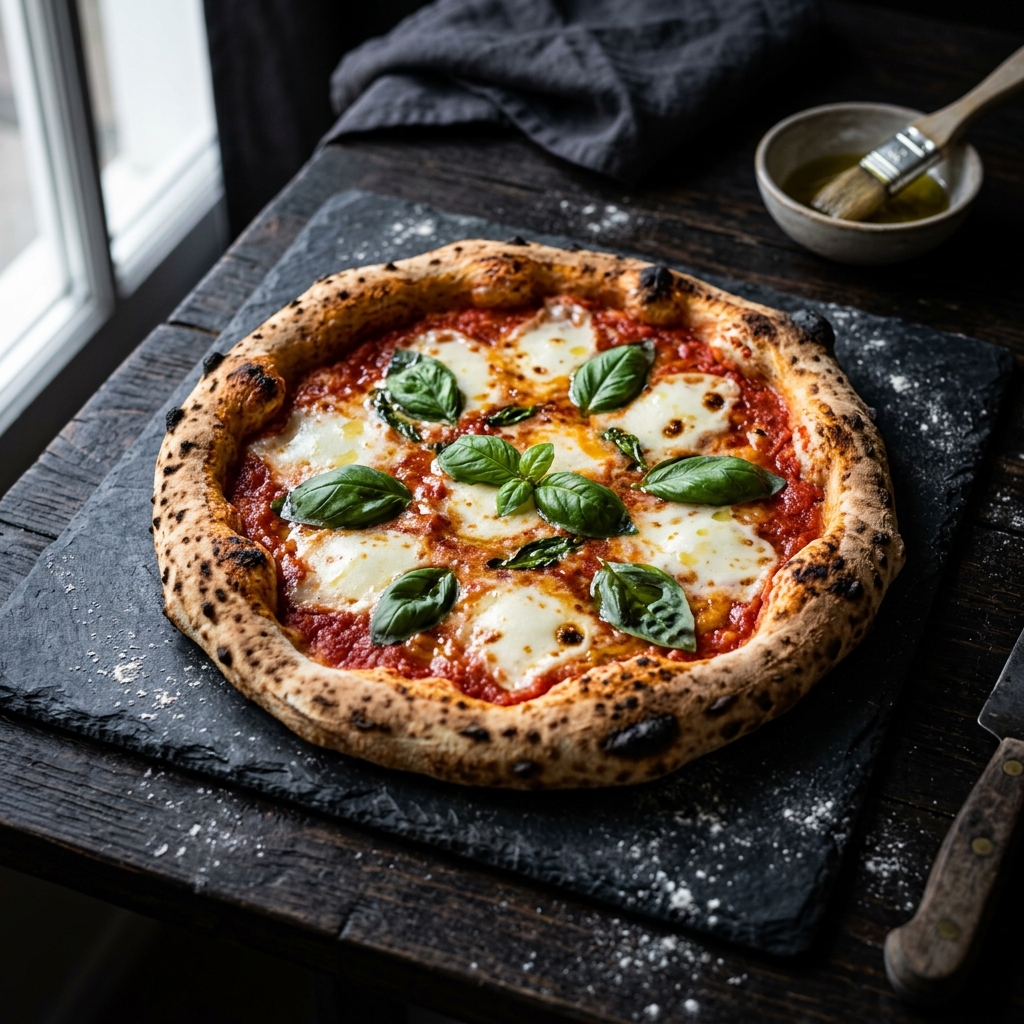
Classic Neapolitan
San Marzano Sauce, Mozzarella, Basil.
₹250
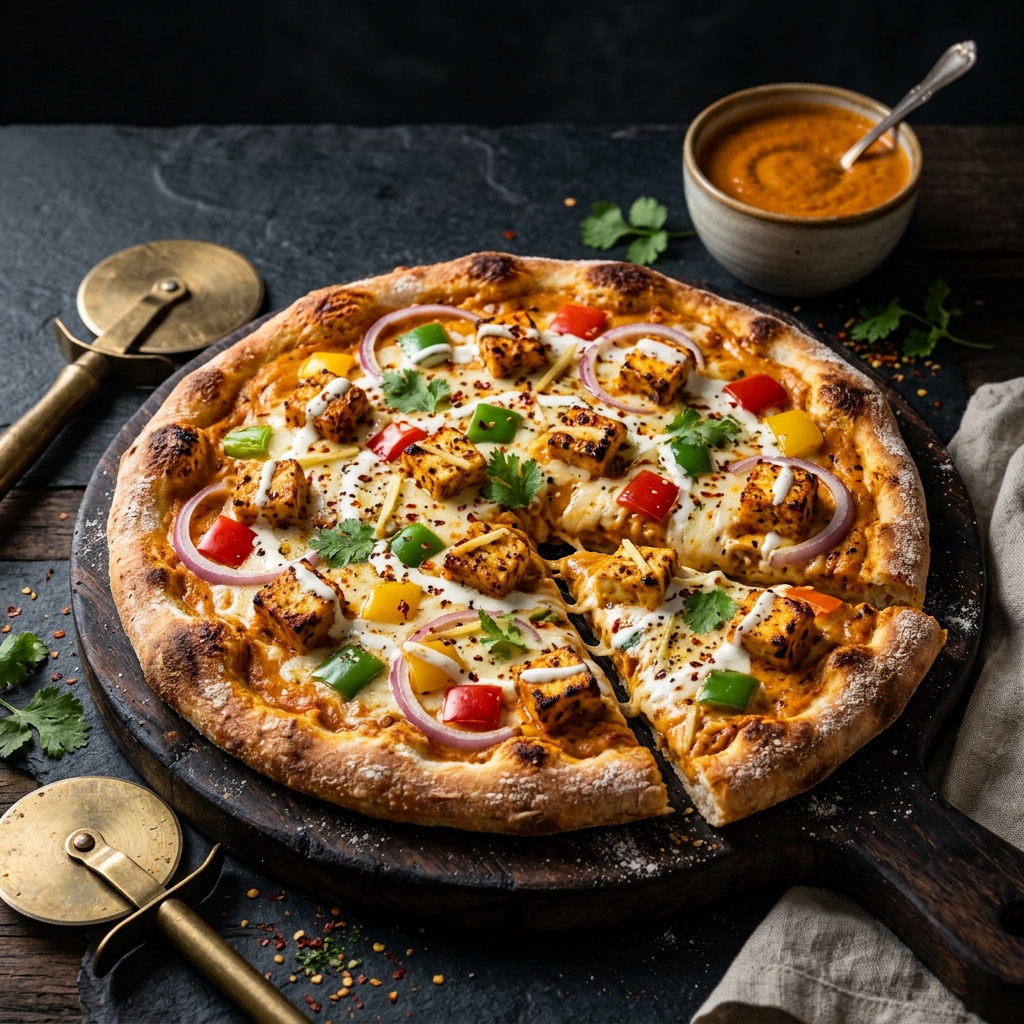
Paneer Makhani Delight
Makhani Sauce, Paneer Tikka, Bell Peppers.
₹280
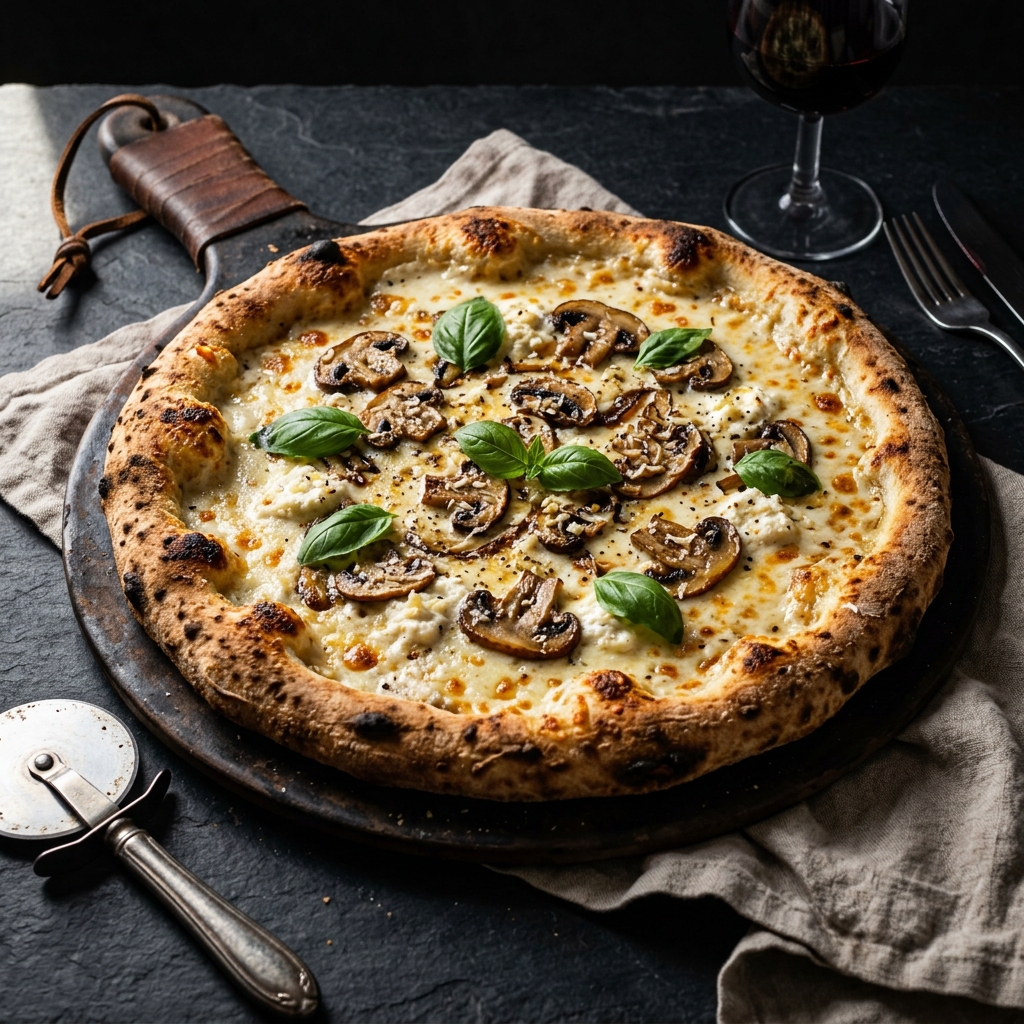
Alfredo Delight
White Sauce, Mushrooms, Mozzarella.
₹310
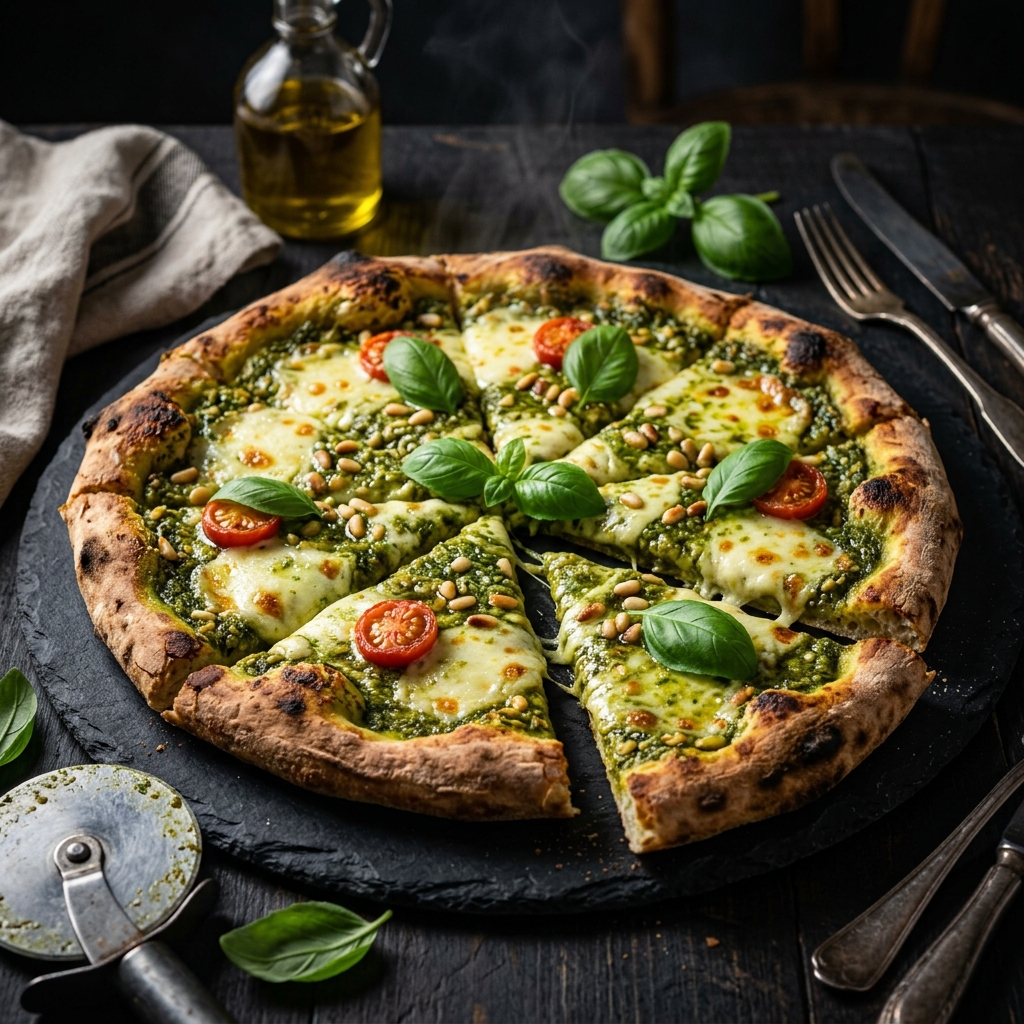
Pesto Pizza
Basil Pesto Sauce, Mozzarella.
₹310
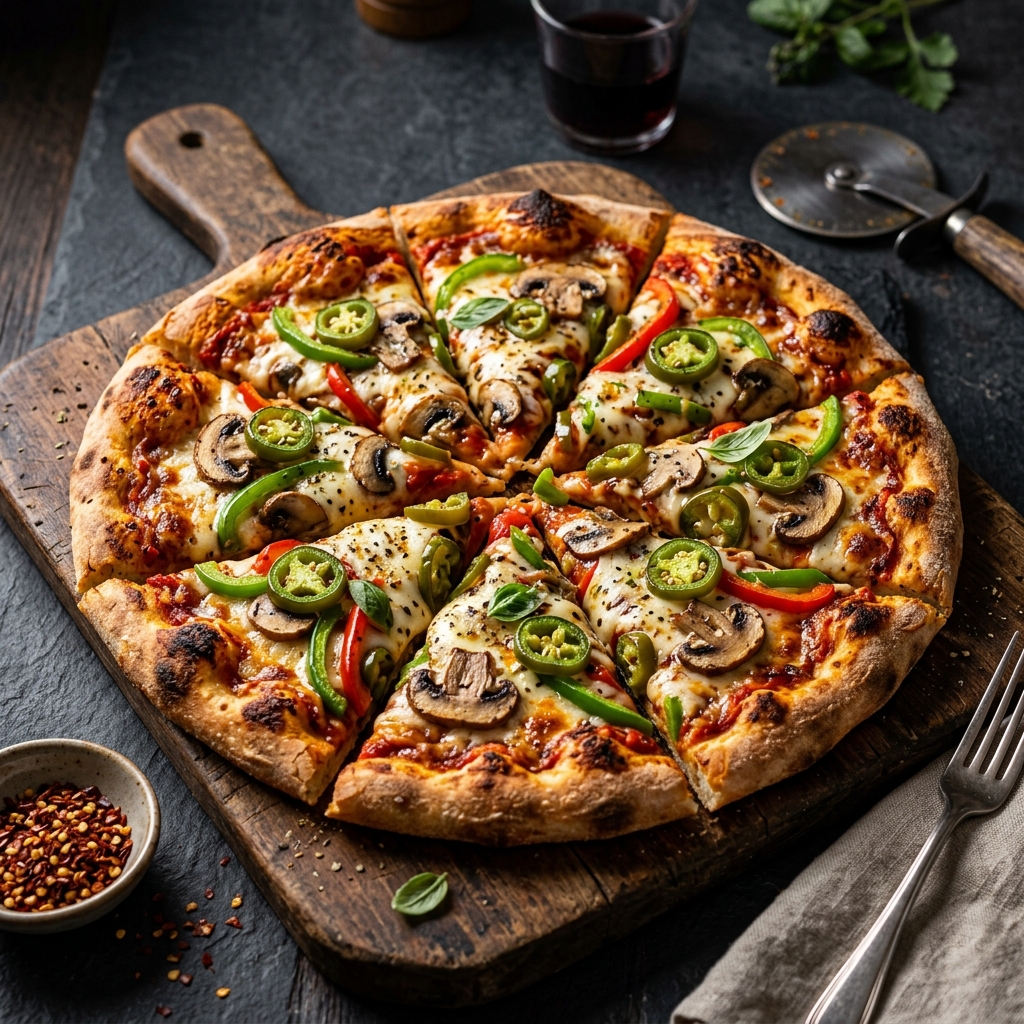
Veggie Delight
Mushrooms, Jalapeños, Bell Peppers.
₹280
Coming Soon
Coming Soon